
Mantle price is flashing a cluster of early reversal signals even as it remains deep in the red for January, raising the question of whether the token can claw back recent losses or if another leg down is coming.
Over the past two weeks, Mantle (MNT) has slid more than 22%, mirroring a broader risk-off shift across crypto. Data shows the token dropping from around $1.13 on Jan. 6 to roughly $0.88 in morning Asian trading. From a wider perspective, the damage looks even harsher: MNT now trades nearly 69% below its October all‑time high near $2.86.
This retracement has unfolded against a difficult macro and sector backdrop. The digital asset market has been absorbing another wave of liquidations as traders reassess positioning heading into 2026. Bitcoin has failed to reclaim the six‑figure price level it lost during a sharp correction in mid‑November, undercutting broader market confidence and dampening risk appetite across altcoins.
Global sentiment has also been shaken by a renewed flare‑up in trade tensions between the United States and the European Union. Investors have increasingly shifted to a defensive posture after President Trump’s ultimatum around the acquisition of Greenland, a move that has stirred fresh geopolitical uncertainty. At the same time, the crypto industry is contending with delays surrounding a key market structure bill progressing through the U.S. Senate, injecting additional regulatory anxiety into an already fragile environment.
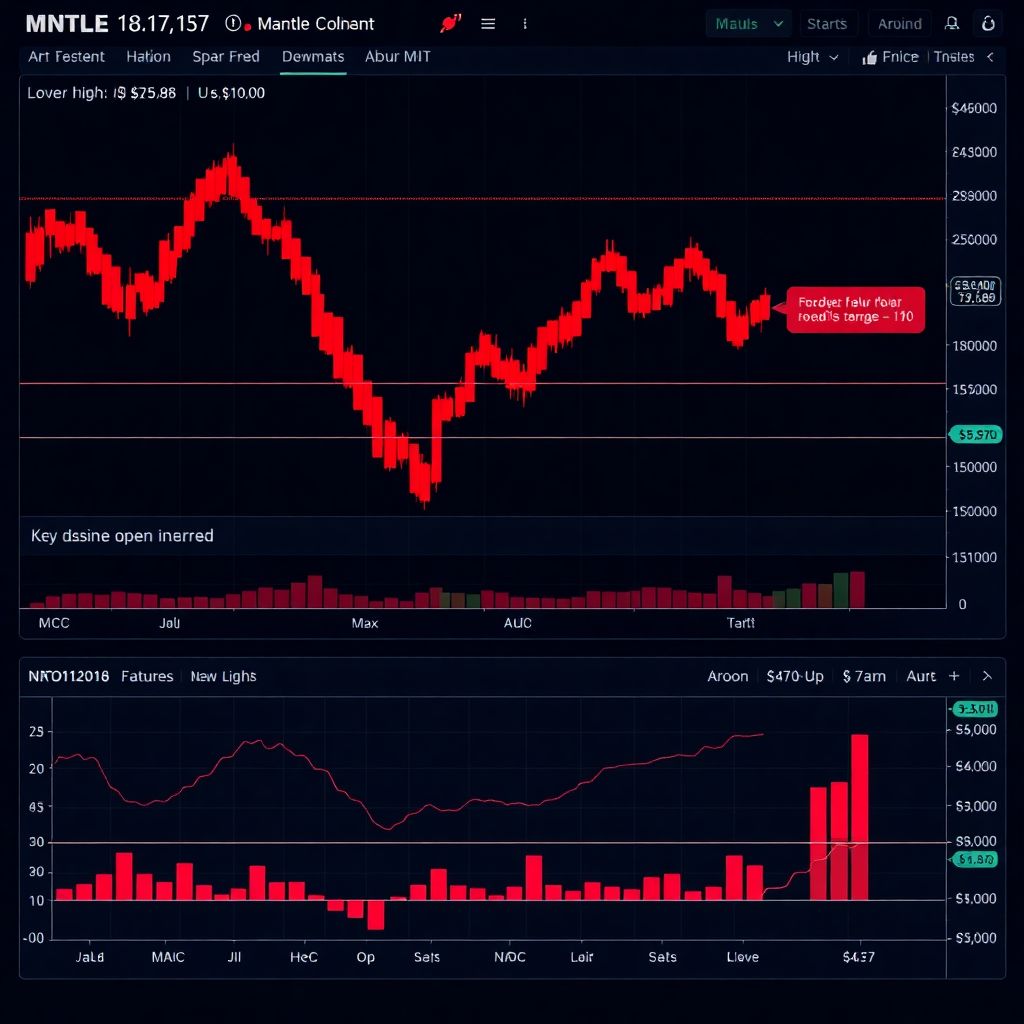
Speculative interest in Mantle has cooled sharply. Figures from derivatives tracking platforms show that futures open interest on MNT has plunged to roughly $59 million, down from a staggering $490 million at the height of enthusiasm in October. That collapse in leveraged positioning underscores how aggressively short‑term traders have exited the market, leaving spot flows and long‑only holders to dictate direction.
Even a high‑profile listing on a major U.S. retail trading app failed to spark a sustainable bid. Under typical conditions, such a listing might trigger a short‑term volume spike and a sentiment boost. This time, however, the broader market meltdown largely drowned out the news, and MNT continued to drift lower as macro and regulatory headwinds dominated investor psychology.
Beneath the surface, though, on‑chain metrics are beginning to diverge from the weak price action. Data from blockchain analytics platforms points to a significant outflow of Mantle from centralized exchanges, with tracked MNT reserves sliding from a monthly high of about $1.93 billion to roughly $1.89 billion. That decline in exchange balances is often interpreted as a constructive sign: when tokens leave trading venues for self‑custody, it typically indicates that holders are less inclined to sell in the near term and are instead preparing to hold through volatility.
This shift in supply dynamics matters because it can quietly tighten the amount of MNT available for immediate sale. If selling pressure begins to wane while more tokens are removed from exchanges, any incremental uptick in demand can translate into outsized price moves. In illiquid or thinning order books, even modest buy‑side flows can trigger sharp short‑covering rallies.
From a purely technical perspective, Mantle’s daily chart currently shows the asset trading within a descending parallel channel. In the short run, this pattern validates the prevailing bearish trend: prices are making lower highs and lower lows inside well‑defined boundaries. However, technicians frequently view such channels as potential bullish continuation structures when they emerge after a strong prior uptrend. A sustained breakout above the channel’s upper boundary is often interpreted as evidence that sellers are losing control.
The key confirmation signal would be a decisive daily close above that upper resistance line, ideally backed by rising volume. Such a move would likely force short sellers to cover positions, generating a squeeze that feeds additional upside momentum. At the same time, sidelined capital watching for a clear reversal could begin to reenter, further amplifying the move.
Another constructive formation has appeared on the chart: a double bottom pattern. This setup forms when price carves out two distinct lows at approximately the same horizontal level, separated by an intervening rally. The structure reflects a scenario in which buyers step in to defend a critical area twice, signaling that demand may be beginning to absorb available supply. If price subsequently breaks above the “neckline” or intermediate peak between the two troughs, the pattern is considered validated and often projects a measurable upside target.
In Mantle’s case, the $0.85 region has emerged as the pivotal support zone to watch. As long as bulls hold this floor and continue removing tokens from exchanges, the ingredients for a relief rally remain in place. The first logical upside target in such a scenario would be the psychological $1.00 level, where many traders tend to cluster orders. A clean, sustained break above $1.00 would strengthen the case that the double bottom is in play and open the door to an extension toward roughly $1.20, a target that aligns with the measured move implied by the height of the descending channel.
Failure to defend $0.85, on the other hand, would likely embolden bears. A breakdown below that support could expose the next important demand zone around the August 2 low near $0.67. That area represents a historical pivot where buying interest previously emerged, and it would likely become the new battleground between bulls looking for value and sellers pressing their advantage.
Momentum indicators currently lean in favor of the bearish camp. The MACD (Moving Average Convergence Divergence) lines remain below the zero baseline, signaling that downward momentum still has the upper hand. As long as MACD stays negative and fails to produce a convincing bullish crossover, traders may be hesitant to call a firm bottom.
The Aroon indicator paints a similar picture. With the Aroon Down reading at approximately 85.7% and the Aroon Up languishing at 0%, the tool suggests that recent lows are dominating the price structure while new highs are essentially absent. This combination is typical of a market where sellers remain firmly in control and where another marginal low could develop before any durable trend reversal takes hold.
For Mantle to meaningfully recover from its January drawdown, several pieces likely need to fall into place at once. First, the broader macro and crypto backdrop must at least stabilize. As long as Bitcoin struggles below previous milestones and regulatory uncertainty looms over the sector, capital flows into higher‑beta tokens like MNT may remain constrained. A shift in narrative—from fear of tighter regulation and geopolitical risk to renewed optimism about growth or innovation—could be a key catalyst.
Second, Mantle’s own ecosystem fundamentals will matter more as speculative leverage continues to unwind. Developers, real‑world integrations, and on‑chain activity can all help rebuild a fundamental investment case independent of short‑term hype. If user metrics, protocol revenues, or total value locked begin to trend higher even while price is under pressure, long‑horizon investors may see that as an opportunity to accumulate, reinforcing the exchange outflow trend already underway.
Third, positioning will be crucial. The collapse in futures open interest from $490 million to about $59 million cuts both ways. On one hand, it signals reduced speculative demand and less immediate fuel for explosive rallies. On the other, it means that much of the previously frothy leverage has already been cleared out. In such a cleaned‑up environment, new long positions or renewed speculative interest can sometimes drive stronger directional moves because there is less overhang from overcrowded trades.
Risk management remains essential for anyone watching Mantle’s next moves. The price region between $0.85 and $1.00 is shaping up as the primary decision zone in the short term: a defended support and breakout through resistance could validate the bullish reversal patterns and set the stage for a more extended recovery. Conversely, a failure at $0.85 accompanied by rising volume would signal that sellers are not done yet and that the path toward $0.67 may open.
Timeframe also plays a role in how the current setup is interpreted. Short‑term traders may focus on intraday volatility inside the descending channel, taking advantage of bounces between support and resistance while waiting for a confirmed breakout. Swing traders and longer‑term participants are more likely to key in on the weekly structure, the double bottom’s neckline, and whether on‑chain data continues to show net outflows from exchanges. Patience and a clear trading plan can help avoid impulsive decisions driven by noise.
Psychology should not be underestimated either. A drawdown of nearly 69% from the all‑time high can inflict deep “bagholder fatigue,” where early entrants either capitulate near lows or disconnect from the market entirely. Recoveries in such conditions often unfold in phases: an initial short‑covering rally, a period of choppy consolidation as skeptics fade every bounce, and, if fundamentals improve, a later, more sustainable uptrend. Understanding this dynamic can help frame reasonable expectations rather than hoping for an immediate V‑shaped reversal.
Looking ahead, Mantle sits at a crossroads where technical patterns, on‑chain flows, and macro currents intersect. The double bottom and descending channel hint that the worst of the downtrend could be nearing exhaustion, but the MACD, Aroon, and fragile sentiment argue that caution is still warranted. Whether MNT can undo its January losses will depend on how price behaves around $0.85 support, how quickly risk appetite returns to crypto at large, and whether the quiet accumulation suggested by falling exchange balances ultimately outweighs the pressure from a still‑dominant bearish trend.