
Cardano price hints at bullish reversal even as TVL and stablecoin supply shrink
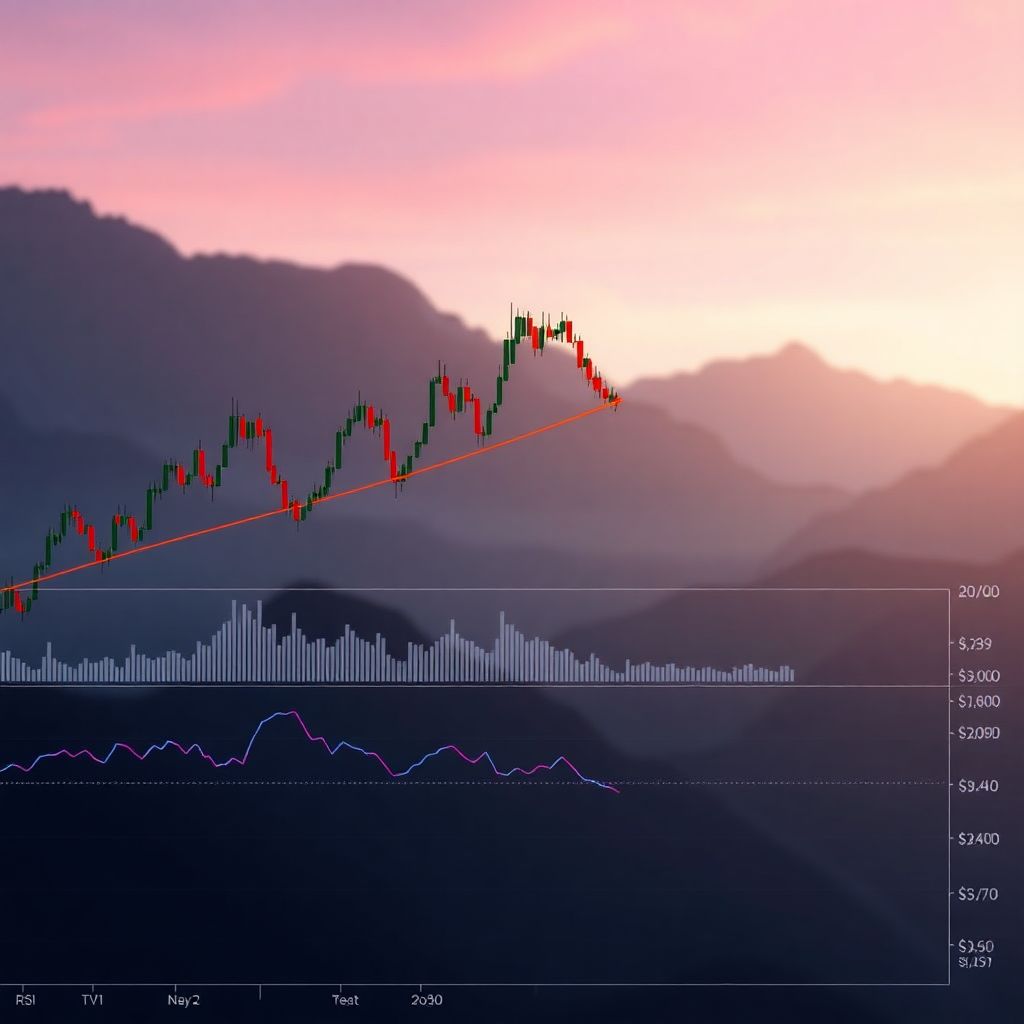
Cardano’s (ADA) market structure is starting to show signs of an upside reversal, even though most of its core on‑chain metrics have been trending lower for months. A classic bullish wedge pattern has emerged on the daily chart, suggesting that a relief rally of around 45% could be on the table if buyers manage to break key resistance levels.
ADA price under pressure as fundamentals soften
Since peaking in October, Cardano has undergone a deep correction. From that high, the token has lost about 63% of its value, and it now trades roughly 25% below its December local top. Over the same period, ADA’s market capitalization has slumped from around $35.1 billion to about $12.9 billion, reflecting the broader risk‑off mood surrounding the project.
On-chain activity confirms this cooling in enthusiasm. Data on total value locked (TVL) across decentralized finance applications built on Cardano shows a steep retracement from the August peak near $544 million to roughly $215.5 million today. TVL is often viewed as a proxy for user engagement and capital commitment within an ecosystem; its decline implies that fewer users are deploying assets into Cardano-based protocols or that existing users are withdrawing liquidity.
Shrinking stablecoin base adds to the caution
Stablecoins often function as “dry powder” within a blockchain ecosystem, signaling how much capital is parked and ready to be deployed into DeFi, trading, or yield strategies. On Cardano, the aggregate market cap of stablecoins has slipped from about $40.48 million in November to around $37.68 million.
While the drop may appear small in absolute terms, it’s meaningful for a network that is still building out its DeFi footprint. Less stablecoin liquidity can translate into thinner order books, higher slippage for trades, and reduced borrowing and lending activity. Together, these dynamics make it harder for Cardano-based protocols to compete with more liquid ecosystems.
Derivatives traders step back
The cautious tone is also visible in the derivatives market. ADA futures open interest has plunged from roughly $1.72 billion in October to about $651 million. Lower open interest usually means fewer leveraged positions and a decline in speculative activity.
This retreat can be interpreted in two ways. On the one hand, it confirms that traders have lost some conviction in ADA’s short‑term upside, contributing to the token’s sluggish price action. On the other hand, the unwinding of leverage often cleans up the market, reducing the risk of sudden liquidations and paving the way for a healthier, more sustainable trend when the next move begins.
Sentiment weak, but technicals turn constructive
Despite the deteriorating fundamentals and fragile sentiment, Cardano’s price chart is beginning to tell a more optimistic story. Since early October, ADA has been tracing out a falling wedge pattern on the daily timeframe—a structure characterized by two downward‑sloping, converging trendlines.
Historically, falling wedges tend to resolve to the upside. They usually appear toward the end of a downtrend, signaling that bearish momentum is waning as each new low is less aggressive than the previous one. When price eventually breaks above the upper trendline with convincing volume, it often marks the start of a trend reversal or at least a strong counter‑trend rally.
Momentum indicators point to a potential rebound
Momentum tools add weight to the bullish wedge narrative. The Relative Strength Index (RSI) has been forming a bullish divergence—price is printing lower lows, while RSI has begun to rise from oversold territory. This divergence suggests that selling pressure is weakening beneath the surface and that buyers are slowly regaining control.
A bullish RSI divergence does not guarantee a reversal, but when it aligns with a recognized chart pattern such as a falling wedge, the probability of at least a sizable bounce increases. Traders typically look for confirmation through a breakout above a nearby moving average or resistance level.
Key level to watch: 20‑day SMA near $0.39
For ADA, the immediate line in the sand is the 20‑day simple moving average (SMA), currently hovering around $0.39. This moving average has recently acted as dynamic resistance, rejecting several attempts by the price to reclaim higher ground.
A daily close above the 20‑day SMA, especially if accompanied by rising volume, would strengthen the case that Cardano has broken out of the wedge pattern. Such a move would signal that short‑term sentiment is turning and that sidelined buyers may start to re‑enter the market.
Upside and downside scenarios
If the breakout from the wedge is confirmed, the technical target sits near $0.51. This level is derived by measuring the maximum height of the wedge and projecting it upward from the breakout point. From current prices, that implies a potential gain of roughly 45%.
However, the pattern also has a bearish invalidation point. A decisive breakdown below the lower trendline of the wedge would negate the bullish thesis and could trigger another leg lower, with $0.30 emerging as the next significant support. This price area has held multiple times over the past year, making it a crucial zone for long‑term bulls to defend.
How traders might approach the current setup
For short‑term traders, the setup is relatively clear: the wedge’s upper boundary and the 20‑day SMA form the immediate resistance band, while the wedge’s lower boundary and the $0.30 level make up the key support area. Breakouts or breakdowns from these zones often provide actionable signals.
More conservative participants may wait for additional confirmation, such as a retest of the breakout level as support or an uptick in volume and derivatives interest. Watching funding rates, perpetual swap open interest, and spot order book depth can help confirm whether a move is backed by genuine demand or is merely a short‑lived squeeze.
What this means for long‑term Cardano holders
For long‑term investors, the current environment is a test of conviction. On the one hand, declining TVL, shrinking stablecoin presence, and falling derivatives activity highlight real challenges for Cardano’s ecosystem. Competing smart contract platforms are intensifying their development and incentive programs, making it harder for ADA to attract and retain capital.
On the other hand, prolonged drawdowns and depressed sentiment have historically been the phases in which patient investors accumulate, provided they still believe in the project’s roadmap, technology, and community of builders. A successful breakout from the falling wedge could mark the beginning of such an accumulation phase, especially if it is followed by renewed growth in on‑chain activity.
Ecosystem growth will be key beyond the next rally
Even if ADA achieves the projected 45% rally, a sustainable uptrend will likely require more than a favorable chart pattern. The network needs to demonstrate progress in areas such as:
– Launch and adoption of new DeFi protocols and stablecoin projects.
– Improvements in scalability, fees, and user experience for everyday users.
– Enhanced developer tools and incentives that simplify building on Cardano.
– Integration with cross‑chain bridges and liquidity layers to attract external capital.
Price can front‑run fundamentals in the short run, but long‑lasting bull cycles generally coincide with visible ecosystem expansion—more users, higher TVL, and a richer set of real‑world applications.
Risk management remains essential
Market participants should keep in mind that wedge patterns can fail, especially in macro environments where risk assets face pressure from interest rates, regulatory uncertainty, or broader liquidity shifts. A breakdown below the wedge and the loss of the $0.30 support could open the door to deeper downside and extended consolidation.
For anyone active in the market, setting clear invalidation levels, sizing positions conservatively, and avoiding excessive leverage are critical. Technical setups like the one on Cardano can offer attractive opportunities, but they should be approached within a well‑defined risk framework.
Educational, not prescriptive
The current constellation of weak fundamentals and improving technicals makes Cardano a notable case study in how markets often turn before the data does. Whether ADA ultimately realizes its 45% upside potential will depend on both chart dynamics and the project’s ability to re‑ignite real, on‑chain demand.
All of the above should be treated as informational and educational analysis, not as a directive to buy, sell, or hold any asset. Every trader or investor should evaluate their own risk tolerance, time horizon, and research before making decisions in the volatile world of digital assets.