
Why Chainlink could rebound toward $10 as oversold RSI hints at a recovery
Chainlink (LINK) is showing early signs of stabilization after an extended sell-off, with price action now clustering around a critical Fibonacci support zone. As downside momentum fades and the Relative Strength Index (RSI) remains firmly oversold, conditions are building for a potential relief rally toward the psychologically and technically important $10 area.
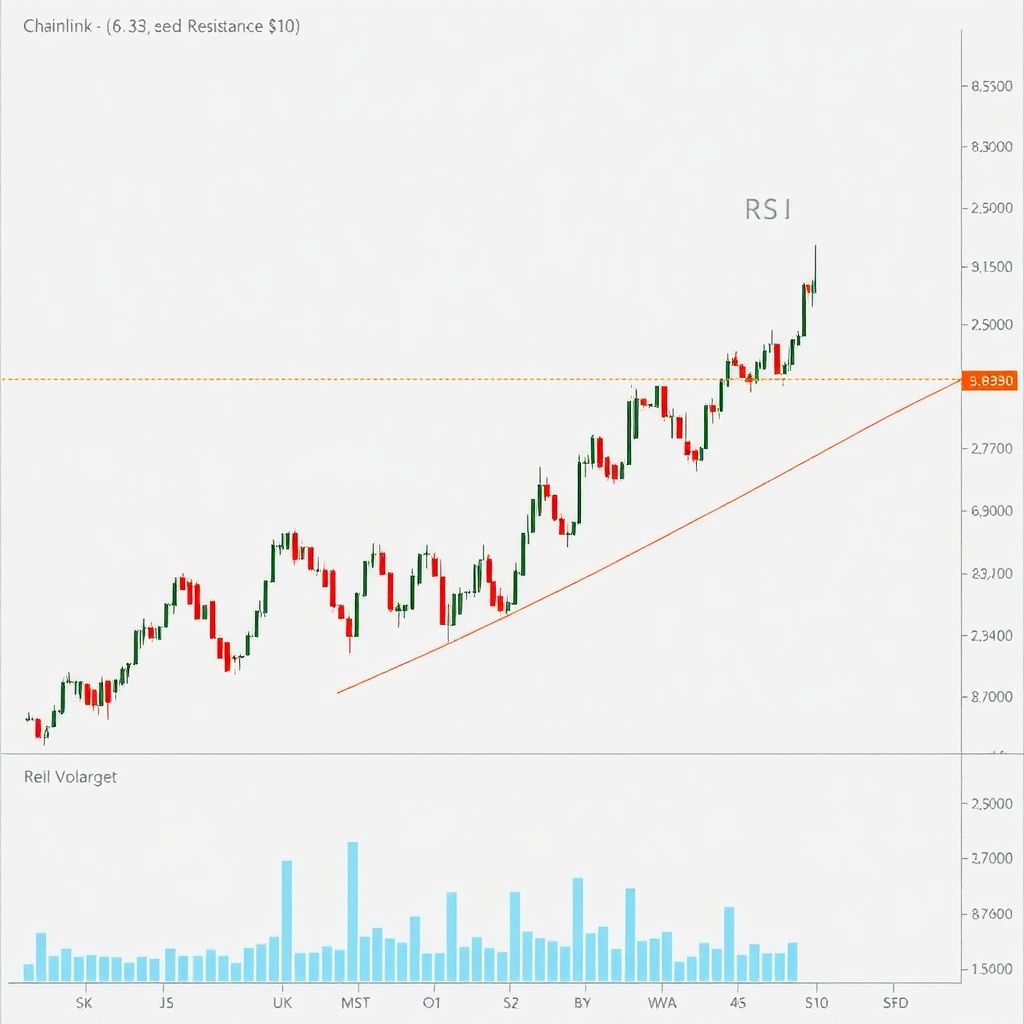
At the heart of the current setup is the $8.33 region, where LINK has carved out a clear swing low. This level aligns with the 0.618 Fibonacci retracement — often called the “golden ratio” — a zone that frequently attracts strong reactions during corrective phases. The market’s decision to hold and bounce from this area signals that sellers are losing dominance and that buyers are beginning to absorb available supply.
The initial reaction from $8.33 has effectively turned this level into a short‑term demand base. As long as price continues to trade above this zone on a closing basis, the broader corrective structure remains constructive. This significantly reduces the odds of an immediate breakdown to fresh lows and instead tilts the balance toward a counter‑trend rebound.
The RSI adds a crucial piece to this picture. Currently entrenched in oversold territory, it reflects an environment of stretched selling pressure. Historically, such readings often precede at least a temporary reversal as markets revert toward more neutral momentum conditions. Oversold signals do not guarantee a full‑fledged trend change, but they frequently accompany sharp, corrective rallies as bearish energy runs out of steam.
In LINK’s case, the oversold RSI follows a protracted downtrend, which strengthens the argument for mean reversion. As price continues to consolidate and edge higher from support, the RSI is likely to climb back toward the mid-range. That process alone can fuel a move higher, as technical traders respond to shifting momentum signals and sidelined buyers gain confidence.
Crucially, recent moves upward do not appear to be driven solely by short covering or algorithmic rebalancing. There are emerging signs of genuine bullish participation — an uptick in fresh buying interest rather than just the unwinding of prior positions. For any rebound to be sustainable, this transition from passive to active demand is essential. It suggests that market participants see value at current levels and are willing to bet on a recovery.
As this bid strengthens, the technical structure now favors a rotation toward overhead resistance rather than an immediate revisit of the lows. The most prominent target on the chart lies near $10, an area that previously served as a supply zone where rallies stalled and sellers stepped back in. From a technical standpoint, this makes $10 a logical objective for a corrective rally emerging from deeply oversold conditions.
A test of the $10 level would serve several functions. First, it would allow the RSI to normalize further, relieving extreme readings and giving the market breathing room. Second, it would provide traders with a clearer read on underlying demand: whether buyers are strong enough to absorb selling around resistance or whether the move was merely a short-lived bounce within a broader downtrend.
How price behaves in the $10 zone will be pivotal. A clean break and sustained acceptance above that threshold — ideally accompanied by rising volume and a series of higher lows — would improve the odds of a more durable trend shift. Conversely, a sharp rejection and return toward $8.33 would point to the rally being purely corrective in nature, with the larger bearish structure still intact.
From a pure technical perspective, the current roadmap is relatively straightforward. As long as LINK defends the $8.33 support on a closing basis, the setup favors consolidation above that floor, followed by attempts to push into higher resistance zones. A series of higher lows on the daily timeframe would reinforce the bullish narrative and confirm that buyers are increasingly willing to step in on dips.
However, a decisive break below $8.33 would materially weaken the outlook. Losing this golden‑ratio support would invalidate the current base-building thesis and re-open the path to deeper retracements. In that scenario, oversold RSI alone would not be enough to justify a bullish stance, and traders would likely reassess downside targets.
Beyond Fibonacci levels and RSI, other technical dimensions also support the possibility of a bounce. Market structure has shifted from a pattern of lower lows and lower highs into what appears to be an early accumulation phase. Candlestick behavior near support — including wicks rejecting lower levels and smaller-bodied candles — suggests decreasing conviction from sellers and growing hesitation to push prices further down.
Volume dynamics can play a crucial confirming role. If the move off $8.33 continues to be accompanied by expanding volume on green candles and relatively muted activity on pullbacks, it would strengthen the argument that fresh capital is entering the market rather than merely rotating among existing holders. While volume confirmation is not yet definitive, early signs of accumulation fit well with the narrative of a relief rally in development.
Traders considering this setup often break the scenario into three tiers: conservative, moderate, and aggressive.
– Conservative participants may wait for a confirmed break above intermediate resistance levels between current price and $10, seeking proof that the bounce has legs before engaging.
– Moderate traders might treat $8.33 as the key invalidation level, positioning for a move toward $10 while closely monitoring RSI normalization and intraday structure.
– Aggressive traders could look for intraday dips toward support zones to build positions, banking on oversold momentum dynamics and the attractive risk‑reward profile of a move from support to overhead resistance.
Risk management remains central. Technical bounces from oversold conditions can be sharp but also short-lived. Failure to respect invalidation levels — such as a daily close back below the key Fibonacci zone — can quickly turn a promising opportunity into a sustained drawdown. For that reason, many market participants will look for confluence: multiple signals all pointing in the same direction, such as strong support, oversold momentum, improving structure, and supportive volume.
It is also important to frame this move correctly in the broader context. The rally currently being discussed is best understood as a “relief rally” or corrective bounce rather than an automatic signal that a new long-term uptrend has begun. Structural bull markets tend to develop over weeks and months, with clearer evidence such as a sustained pattern of higher highs, bullish moving average crossovers, and improving on-chain or fundamental metrics.
Still, relief rallies can be meaningful. They often reset sentiment, shake out late sellers, and provide the market with a chance to reassess fair value. For participants who weathered the prior downtrend, a move toward $10 creates optionality: it offers an opportunity to de-risk, rebalance, or re-enter with a cleaner technical backdrop once the dust settles around resistance.
In summary, Chainlink’s price is currently anchored around a high-probability support zone at $8.33, coinciding with the 0.618 Fibonacci retracement. Oversold RSI readings, waning bearish momentum, and the emergence of fresh buying interest combine to tilt the odds toward a corrective rally rather than immediate further downside. As long as this support holds, the path of least resistance appears to be a move toward the $10 region, where the next critical battle between bulls and bears is likely to unfold.