
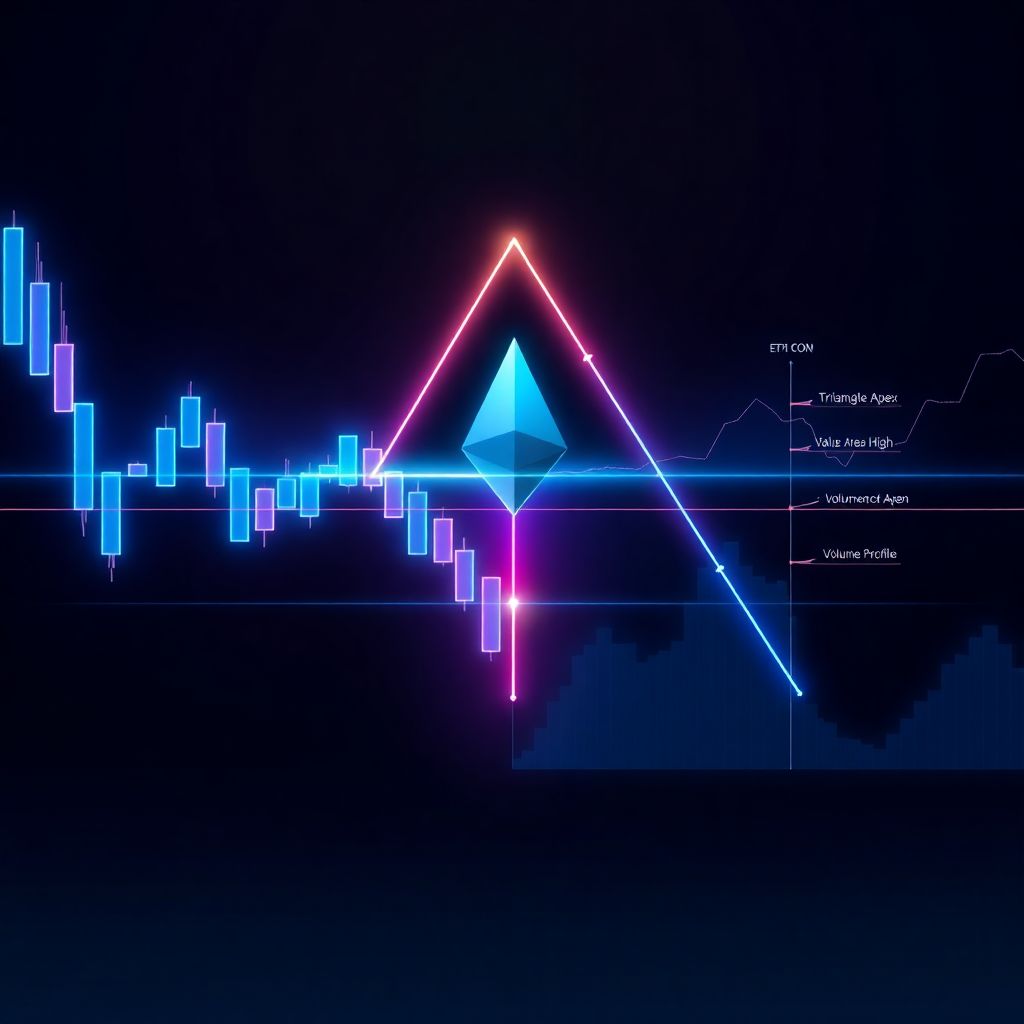
Ethereum price compresses at triangle apex: will the next breakout finally fuel expansion?
Ethereum’s (ETH) price action has entered a decisive juncture as it grinds deeper into a narrowing triangle pattern that has been developing over recent weeks. Both dynamic support and resistance are converging, forcing price into an increasingly tight range where the current balance between buyers and sellers cannot persist indefinitely.
This kind of volatility squeeze often precedes a powerful directional move. The question now is not *if* Ethereum will break out of this structure, but *when* and in which direction – and whether that move will have the volume and follow‑through required to evolve into a meaningful expansion rather than just another short‑lived spike.
Market structure: indecision, not capitulation
Technically, the triangle reflects a classic period of market indecision rather than clear bullish or bearish dominance. A sequence of lower highs signals that buyers are less willing to chase price at elevated levels, while a series of higher lows reveals that sellers are also reluctant to push ETH significantly cheaper. This compression of both sides results in diminished volatility as neither camp manages to seize lasting control.
Such structures typically represent a pause in the broader trend – a cooling-off or “breather” phase – rather than an outright reversal signal. Triangles often form midway through larger moves or as consolidation zones within defined ranges. What matters most is how price behaves once it escapes the pattern and whether the breakout is accepted by the market.
The Point of Control: where balance is anchored
A central feature of the current Ethereum setup is its interaction with the Point of Control (POC) – the price level that has attracted the greatest traded volume within the recent range. The POC frequently acts as a fulcrum between bullish and bearish control. When price hovers around it, as ETH currently does, it indicates a state of balance: neither side has enough conviction to drive price far from this “fair value” zone.
However, this balance rarely lasts forever. Prolonged compression around the POC often precedes sharp rotational moves once the market accepts price either above or below this level. In other words, once traders collectively decide that Ethereum is either overvalued or undervalued relative to the POC, price tends to reprice quickly toward the next key liquidity area.
Triangle apex: volatility has almost nowhere left to hide
As Ethereum edges closer to the apex of the triangle, the space between support and resistance shrinks. Price has less room to oscillate, increasing the probability of a breakout in the near term. At this stage, even a modest influx of new orders – driven by macro news, on‑chain developments, or shifts in risk appetite – can be enough to push ETH out of the pattern.
Yet traders should remember that the mere act of breaking a trendline or pattern boundary is not sufficient. What truly matters is whether the market *validates* the breakout with strong participation and sustained trading outside the former range. A breakout without commitment is usually just noise.
Bullish breakout scenario: what needs to happen
For a bullish outcome, Ethereum needs a decisive close above the triangle’s descending resistance, ideally on elevated volume. That would suggest that buyers are finally stepping in with conviction, overwhelming the supply that has capped price in recent weeks.
Confirmation factors for a bullish expansion include:
– A strong daily or 4‑hour close above resistance, not just a brief intraday spike
– Expanding trading volume accompanying the move
– Follow‑through candles that hold above the breakout level rather than immediately retracing
– Progression toward and potentially above the Value Area High (VAH), signaling acceptance in a higher price zone
Without these elements, upside breaks are vulnerable to becoming classic “fakeouts” – impulsive pushes above resistance that quickly reverse, trapping late buyers and flushing liquidity before price returns to the prior range.
Bearish breakdown scenario: path toward lower value
On the flip side, a clean break below triangle support would imply that sellers have asserted control and that the market is willing to accept Ethereum at lower prices. This type of move often draws price toward the Value Area Low (VAL), the lower bound of the most actively traded recent range.
Key conditions for a credible bearish breakdown include:
– A clear close below the triangle support level on strong or rising volume
– Inability of price to reclaim the broken support on retests (turning it into resistance)
– Acceleration toward the VAL, where previous liquidity and demand zones may sit
– A shift in trader behavior from “buying dips” to “selling rallies” within the new lower range
As with the bullish case, volume will be crucial. A weak, low‑participation drop below support may simply reflect stop‑running and liquidity hunting, not a genuine realignment of market consensus.
Volume: the deciding factor between noise and trend
Regardless of direction, volume will likely be the defining variable in how this pattern resolves. A genuine breakout is typically accompanied by:
– An influx of new participants entering the market
– Elevated trading activity across major exchanges
– A visible expansion of the volume profile outside the previous value area
Muted volume during a breakout attempt suggests hesitation. In that case, the move has a higher chance of failing, with price snapping back into the triangle or continuing to chop sideways within a broader range. For traders, that distinction is critical: low‑volume moves reward mean‑reversion strategies, while high‑volume breakouts favor trend‑following approaches.
Higher time frame context: still a range, not a runaway trend
On higher time frames, Ethereum remains locked within a broader range. The triangle is simply a more granular consolidation pattern inside this larger structure. Until ETH firmly establishes acceptance above the Value Area High or below the Value Area Low, the dominant behavior remains rotational: price oscillates between value zones rather than embarking on a sustained directional trend.
This context helps prevent overreacting to short‑term noise. Even a significant breakout from the triangle may initially just be a move from one side of the range toward the other, not necessarily the start of a new multi‑month bull or bear market.
Liquidity targets after the breakout
Once Ethereum finally resolves the triangle, liquidity will likely guide its path. Markets are naturally drawn toward high‑volume nodes and areas where large orders rest. For ETH, the next major targets are:
– On the upside: the Value Area High and any prior swing highs or consolidation blocks above it
– On the downside: the Value Area Low and previous demand zones where price quickly reversed in the past
These areas often serve both as magnets and potential reaction points. Traders frequently take profits or hedge positions around them, leading to either consolidation or counter‑trend bounces.
Risk management considerations for traders
As price tightens into the apex, the temptation to pre‑empt the breakout grows. However, this phase also carries elevated risk of whipsaws and “fake” moves. Practical considerations include:
– Avoid over‑leveraging into a direction before confirmation
– Use clearly defined invalidation levels outside the triangle boundaries
– Wait for a confirmed close and volume expansion before sizing up trend trades
– Be prepared for a possible retest of the breakout level, which often occurs before the next leg of the move
Patience tends to be rewarded during compression phases; chasing every minor move within the triangle can erode capital before the real opportunity emerges.
How macro and on‑chain factors could influence the breakout
While the current pattern is primarily technical, macro and on‑chain developments can act as catalysts. Potential drivers include:
– Shifts in broader risk sentiment across equities and crypto
– Changes in monetary policy expectations that impact risk assets
– Major Ethereum ecosystem updates, network metrics, or institutional developments
– Fluctuations in on‑chain activity, staking dynamics, and gas usage that affect perceived fundamental value
If such factors align with the technical breakout direction, they can amplify follow‑through and help convert an initial move into a sustained expansion.
What to expect in the coming sessions
As Ethereum trades closer to the triangle apex and clings to the Point of Control, the probability of a volatility expansion in the near term continues to rise. The market is approaching a point where equilibrium will break, forcing price to choose a direction.
Until a decisive move emerges, ETH is likely to remain compressed around the POC, oscillating within a narrowing band as participants position cautiously. Traders and investors should focus on:
– The direction of the initial break from the triangle
– The strength and sustainability of the move, measured by volume and follow‑through
– Whether price finds acceptance above the VAH or below the VAL, signaling a broader shift in value
If a breakout is corroborated by robust volume and sustained trading outside the current range, Ethereum could transition from this prolonged consolidation into a new expansion phase, targeting the next major liquidity zones. Without that confirmation, however, the market remains vulnerable to false signals and continued ranging behavior, keeping ETH locked in a choppy, indecisive environment until a clearer imbalance emerges.