
HBAR price flashes bearish warning as ETF momentum fades
Hedera’s native token, HBAR, is entering a technically fragile phase just as demand for its exchange-traded funds (ETFs) cools. A clearly defined head-and-shoulders pattern has appeared on the chart, while on-chain and ETF data point to weakening conviction among investors.
HBAR stalls above key support as ETFs lose steam
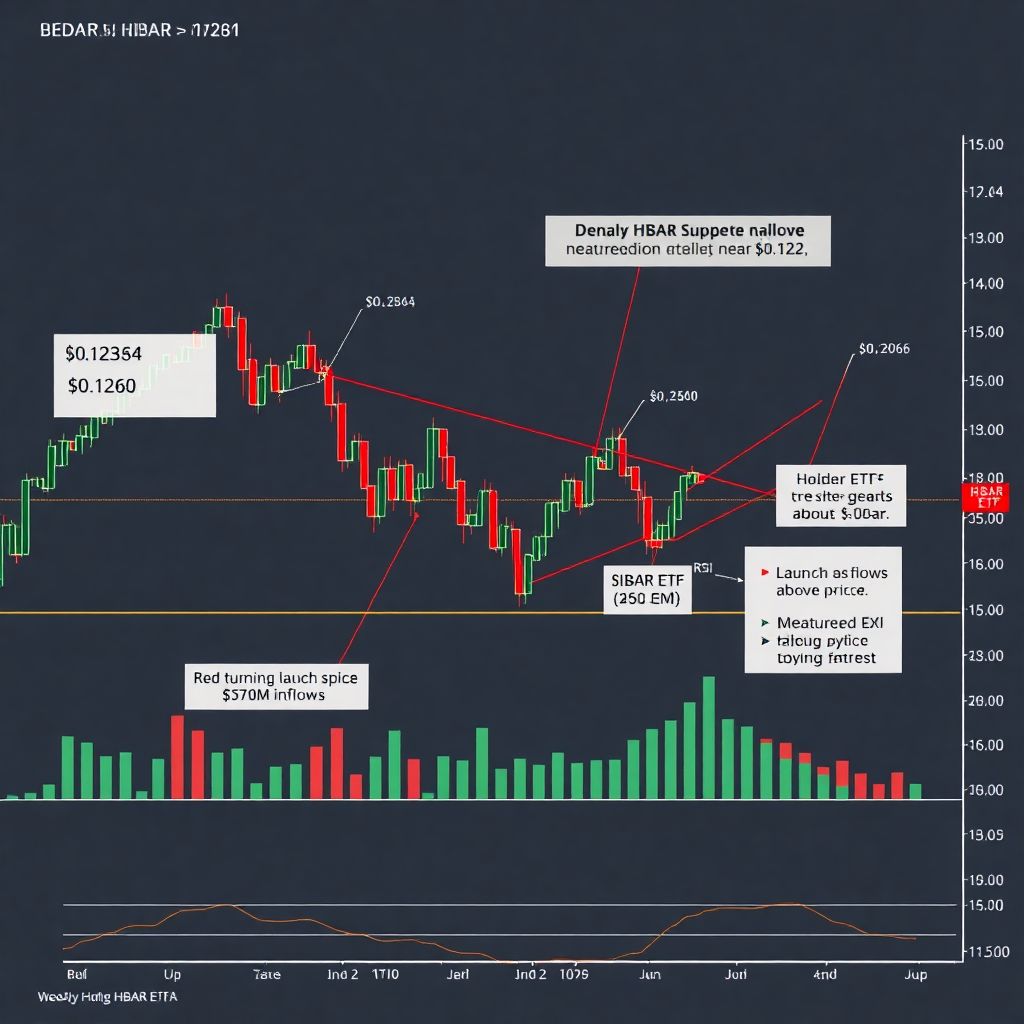
HBAR is trading near $0.1350, more than 55% below its August peak, and has been consolidating in a tight band just above a crucial support zone. This sideways movement comes at a time when capital flowing into Hedera-focused ETFs has slowed considerably.
According to recent ETF data, cumulative inflows into Hedera products have reached roughly $82 million, lifting total net assets to over $61 million. That figure represents about 1.08% of HBAR’s total market capitalization — not insignificant, but no longer accelerating at the pace seen around launch.
Over the last several sessions, the growth rate of these inflows has cooled, suggesting that institutional and sophisticated retail investors may be shifting their attention to other high-profile altcoins such as Solana (SOL), Ripple (XRP), and Chainlink (LINK). In a competitive market for capital, Hedera appears to be losing some relative appeal.
Canary HBAR ETF sees sharp slowdown
The Canary HBAR ETF, one of the flagship spot products tied to Hedera, has seen a particularly notable deceleration.
– The fund recorded no new inflows on Thursday and Friday of the previous week.
– Weekly inflows dropped to about $1.78 million, less than half the prior week’s $4.2 million.
– The ETF’s strongest period remains its launch phase, when it amassed around $70 million in inflows during its first two weeks.
This pattern suggests that the initial wave of enthusiasm — likely driven by novelty, trading strategies around launch, and speculative flows — has faded. Without sustained, organic demand, ETFs can quickly shift from being price-supportive to neutral, or even, in a risk-off environment, a source of additional selling pressure.
Sluggish ecosystem growth weighs on sentiment
One of the key reasons ETF demand may be softening is the slower-than-expected expansion of Hedera’s ecosystem, particularly in decentralized finance (DeFi).
Recent DeFi analytics show:
– Hedera has not attracted notable new DeFi dApps in the last few months.
– Total value locked (TVL) on Hedera-based protocols has fallen by roughly 20% over the past 30 days, down to about $142 million.
– The network’s stablecoin float has shrunk significantly, from over $170 million in November to around $83 million.
TVL and stablecoin supply are closely watched as gauges of on-chain activity and capital efficiency. A contraction in both typically signals reduced user engagement, fewer active strategies, and lower liquidity — all of which can undermine the investment case for a smart-contract platform token like HBAR.
Why this matters for ETF investors
ETF buyers often prefer assets with clear growth narratives: expanding ecosystems, rising protocol revenue, and increasing on-chain usage. When these metrics stagnate or decline, ETF issuers and institutional allocators may deprioritize those assets in favor of platforms showing stronger momentum.
In Hedera’s case, the lack of fresh DeFi deployments and shrinking TVL undermine the story of rapid network adoption. That, in turn, may help explain the loss of follow-through in ETF inflows after a strong start.
A textbook head-and-shoulders pattern emerges
From a technical perspective, HBAR’s chart has taken a distinctly bearish turn.
The token has carved out a head-and-shoulders formation — a classic reversal pattern that often signals the transition from an uptrend to a downtrend:
– The “head” of the pattern formed around $0.3043.
– The left and right “shoulders” sit near $0.2260.
– The neckline — the key support level that defines the pattern’s validity — lies close to $0.1266, a zone that has acted as a floor in April, June, and November this year.
With HBAR now hovering just above this neckline, the market is at an inflection point. A decisive breakdown below the neckline, especially on strong volume, would confirm the head-and-shoulders pattern and signal heightened downside risk.
Measured move points to much lower levels
Traders often estimate the potential downside of a head-and-shoulders break by measuring the distance from the head to the neckline and projecting that downward from the neckline.
In HBAR’s case:
– The gap between the head ($0.3043) and the neckline (~$0.1266) is roughly 58%.
– Applying that same distance below the neckline yields a potential target near $0.052.
While no pattern guarantees a specific outcome, this projection illustrates the scale of the risk if sellers gain full control. A move to that area would mark a deep retracement, erasing a substantial portion of the gains made during prior bullish phases.
Technical indicators reinforce the bearish case
Several widely followed technical indicators currently align with a pessimistic outlook for HBAR:
– Death cross: On October 19, the 50-day Exponential Moving Average (EMA) crossed below the 200-day EMA — a formation often called a “death cross.” This is typically interpreted as a medium- to long-term bearish signal, suggesting that the broader trend has tilted downward.
– Supertrend indicator: HBAR is trading below its Supertrend line, a sign that selling pressure dominates and that attempts at rallies are being capped or sold into.
– Relative Strength Index (RSI): The RSI has been drifting lower for several months, indicating fading momentum and a lack of strong buying interest. A persistently weak RSI can precede further declines, as it reflects waning enthusiasm even during minor price bounces.
Taken together, these tools suggest that bears retain the upper hand unless the market can generate a convincing reversal.
What could invalidate the bearish scenario?
Although the current structure is negative, technical patterns can and do fail. For traders and longer-term investors, it’s useful to understand what developments might weaken or invalidate the head-and-shoulders thesis:
1. Sustained reclaim above the neckline:
A sharp bounce from the $0.1266 area followed by consolidation and continuation higher could turn the neckline back into strong support. If HBAR then pushes convincingly above the shoulder region around $0.2260, it would significantly undermine the bearish setup.
2. Reacceleration of ETF inflows:
A renewed wave of capital into Hedera ETFs — driven by new institutional allocations or macro catalysts — could absorb sell-side pressure and stabilize price action.
3. Visible ecosystem catalysts:
Major dApp launches, a clear uptick in TVL, partnerships with large enterprises, or new real-world asset projects on Hedera could shift narrative and sentiment. Markets often react in advance to credible signs of fundamental improvement.
4. Macro tailwinds for altcoins:
If broader risk assets and altcoins enter a strong bullish phase, HBAR could benefit from rising tide dynamics, reducing the likelihood of a full measured-move breakdown.
Until one or more of these factors materialize, however, the path of least resistance remains to the downside.
Risk management considerations for HBAR holders
For those already exposed to HBAR, the current setup calls for disciplined risk management:
– Define clear invalidation levels:
Many technical traders would treat a clean break and daily close below the neckline as a trigger to reduce exposure. Others might use nearby moving averages or prior swing lows as exit points.
– Avoid averaging down blindly:
Continuously buying dips in the midst of a validated head-and-shoulders breakdown can compound losses. If adding to positions, it’s often safer to wait for signs of a bottoming process, such as divergence on momentum indicators or a base-forming pattern.
– Position sizing and time horizon:
Short-term traders may opt for tight stops and smaller sizes, while longer-term believers in Hedera’s technology might maintain a core position but hedge or trim during obvious technical stress.
– Monitor on-chain and ETF data:
Watching TVL shifts, stablecoin flows, and weekly ETF inflows can offer early clues as to whether the fundamental backdrop is improving or deteriorating further.
How traders might approach the current setup
Short-term market participants often view a developed head-and-shoulders near its neckline as a tradable configuration:
– Bearish traders may look for a confirmed breakdown below $0.1266 with increased volume and then target lower support zones, with $0.052 as an extreme projection.
– More conservative participants might wait for a retest of the broken neckline from below — a common “throwback” move — to seek better risk-reward entries.
– Contrarian bulls could attempt to trade a bounce off the neckline, but this is inherently riskier in the face of aligning bearish indicators and should be paired with tight risk controls.
In all cases, traders typically rely on a combination of price action, volume, and broader market context rather than a single pattern in isolation.
Longer-term outlook for Hedera beyond the chart
Despite the current technical stress, the longer-term fate of HBAR will ultimately depend on adoption and utility rather than chart patterns alone.
Key drivers to watch include:
– Enterprise and institutional use cases:
Hedera emphasizes enterprise-grade performance and governance. If major companies expand their usage of Hedera’s network for tokenization, supply chain, identity, or payments, that could provide a more durable foundation for demand.
– DeFi and real-world assets:
Reversing the decline in TVL and attracting new protocols — especially those handling real-world assets or institutional liquidity — would help rebuild confidence in Hedera’s on-chain economy.
– Developer incentives and tooling:
Competitive grants, robust tooling, and streamlined onboarding could encourage more builders to deploy on Hedera, seeding future network effects.
– Regulatory clarity and ETF evolution:
As regulators refine their stance on digital asset products, Hedera’s ETF landscape may evolve. New vehicles, broader distribution, or improved market conditions could revive interest in HBAR-based funds over time.
For now, however, the disconnect between Hedera’s long-term aspirations and its short-term technicals is evident.
Bottom line
HBAR stands at a pivotal technical juncture. A mature head-and-shoulders pattern, weakening momentum indicators, and a sharp slowdown in ETF inflows all point to elevated downside risk if the $0.1266 neckline fails decisively. On-chain data — falling TVL and declining stablecoin supply — adds fundamental weight to the bearish case.
To navigate this environment, market participants need to balance respect for the current trend with awareness that sentiment can shift quickly if ecosystem growth or ETF demand revives. Until such catalysts clearly emerge, the chart is sending a clear message: caution is warranted.