
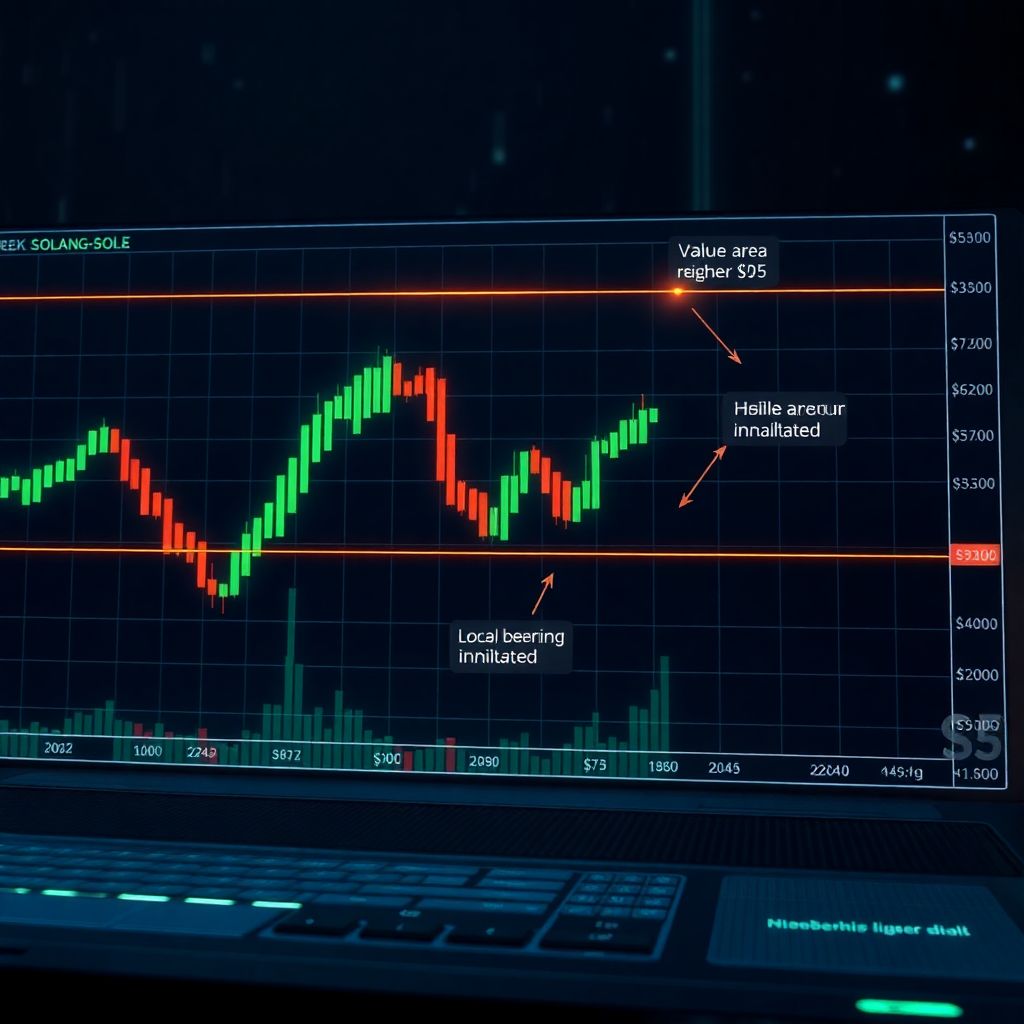
Solana price breaks local downtrend as bulls target the $95 resistance zone
Solana’s price structure has undergone a notable shift, with the token snapping out of its short-term bearish pattern and hinting at a possible momentum rotation in favor of buyers. The break of the local downtrend has allowed SOL to print a fresh swing high, placing the $95 resistance region firmly back on the radar as the next logical upside objective.
Key technical takeaways
– The recent break of the local bearish structure signals a potential change in short-term trend.
– Holding above the value area low is crucial for sustaining the bullish case.
– A sequence of higher highs and higher lows would confirm a constructive shift in market bias.
– The $95 zone remains the key upside resistance and primary target in the current phase.
– Short-term volatility and pullbacks are likely as the market digests the breakout.
Local bearish structure invalidated
For much of the recent trading period, Solana had been confined within a short-term downtrend characterized by a pattern of lower highs and lower lows. This setup gave sellers clear control and kept price action biased to the downside.
That structure has now been broken. Solana has pushed through prior local resistance and established a new swing high on lower timeframes, effectively invalidating the immediate bearish bias. From a pure market structure standpoint, this move shifts short-term momentum toward the buy side and marks an important technical inflection point.
Market structure breaks like this often serve as early warnings that a trend may be nearing exhaustion. In Solana’s case, the breakout suggests that sellers are no longer able to consistently push price lower and that buyers are willing to absorb supply at higher levels.
Why the value area low matters
Despite the promising breakout, the bullish shift is not fully confirmed until Solana proves it can hold above the value area low of the current trading range. This level represents the lower boundary of what the market has recently deemed “fair value” and often acts as a critical battleground between bulls and bears.
As long as SOL stays above this zone, the market has room to form a higher low — a key ingredient in building a sustainable uptrend. A successful higher low would:
– Cement the idea that the downtrend has been interrupted.
– Provide a clear support reference for risk management.
– Increase confidence that the move is more than just a short-lived squeeze or reaction.
If price falls back below the value area low and stays there, it would suggest that the market is slipping back into balance. In that scenario, the odds of renewed range-bound behavior or another leg lower would rise, putting the bullish narrative on pause.
Higher highs and higher lows: the shift in bias
The recent higher high is only the first step toward a more convincing bullish structure. To fully transition the market bias, Solana needs to build a sequence of both higher highs and higher lows. This pattern signals that buyers are consistently stepping in earlier and are willing to pay increasingly higher prices over time.
In practical terms, traders will be watching for:
– The next corrective pullback: Does it stall above the prior swing low?
– Follow‑through buying: Can price push beyond the new swing high without immediate rejection?
– Volume and participation: Are breakouts supported by increased activity, or are they thin and easily faded?
If these conditions are met, the prior bearish narrative within the trading range will be gradually replaced by a more constructive outlook, paving the way for a broader upside continuation.
The $95 resistance zone comes back into play
With the local bearish structure broken, attention naturally shifts to the next clear area of overhead resistance. The $95 region stands out as a significant high‑timeframe barrier where price has previously encountered selling pressure and rejection.
A push into this zone would be consistent with typical post‑breakout behavior, where markets often gravitate toward the next major liquidity pocket. The $95 level is important for several reasons:
– It marks an upper boundary of the broader trading range.
– It represents a prior inflection area where sentiment flipped in the past.
– It is likely to attract both profit-taking from early longs and fresh short interest from range traders.
How Solana reacts near $95 will be crucial in determining whether this move matures into a more extended rally or simply evolves into another range rotation.
What to expect from upcoming price action
In the near term, traders should anticipate a period of choppy and sometimes aggressive intraday movement as the market adjusts to the new structure. Breaks of key levels often lead to:
– Retests of the breakout zone.
– Fast, shallow pullbacks that test the conviction of late buyers.
– Short squeezes or liquidity hunts around obvious stop levels.
Healthy pullbacks that respect the new support zones — especially the value area low and subsequent higher lows — will strengthen the bullish case. Conversely, deep retracements that slice back through those levels with ease would signal that the market needs more time before attempting a sustained drive toward $95.
Scenarios to consider: bullish and bearish paths
From here, price can broadly follow one of two paths:
Bullish continuation scenario:
– Solana consolidates above the value area low, forming a higher low.
– Buyers defend dips aggressively, preventing a return to the prior downtrend.
– Momentum builds, and SOL grinds higher toward the $95 resistance.
– A strong test of $95 with elevated volume opens the door to a possible breakout into the upper band of the wider range.
Failure and rotation scenario:
– Solana loses the value area low, invalidating the newly formed support.
– The breakout is revealed as a short-lived reaction, leading to a return to prior trading ranges.
– Price falls back into consolidation, with sellers regaining the upper hand and buyers stepping aside until a more favorable structure appears.
Traders will be adjusting their bias as new data emerges, but for now, the balance of evidence favors at least an attempt to explore higher levels.
Timeframes: how different traders might view the move
The significance of this structure break depends heavily on the timeframe being traded:
– Short‑term traders (intraday to a few days) may see this as a clear opportunity to play momentum, buying dips as long as intraday support levels hold and quickly cutting risk if the value area low is breached.
– Swing traders are more focused on whether Solana can establish and protect a higher low before targeting the $95 region, using that level as either a profit target or a potential pivot for the next decision.
– Position traders and investors may interpret the current shift as an early signal of a broader cycle transition but will likely wait for confirmation on higher timeframes — such as a series of weekly higher lows — before significantly increasing exposure.
Understanding which timeframe you are trading is essential; a structure break on lower timeframes can fail without necessarily altering the larger trend.
Risk management around the $95 target
For those positioning for a move toward $95, risk management is as important as the directional call:
– Entry zones: Many traders will prefer entries near support — such as the value area low or the first significant higher low — rather than chasing vertical moves.
– Stop placement: Logical invalidation points sit below recent swing lows or under the value area low. A decisive break below these levels would argue against the immediate bullish thesis.
– Profit-taking: Partial profits ahead of the $95 resistance can help lock in gains while still allowing participation if a breakout extends beyond that level.
By pre‑defining these parameters, traders can avoid emotional decision‑making as volatility increases.
Broader market context and sentiment
While Solana’s own structure has clearly improved, it still trades within the broader context of the overall crypto market. Mixed conditions across major assets can:
– Slow down the pace of any move toward $95.
– Increase the likelihood of sharp intraday reversals.
– Create divergences where SOL temporarily outperforms or underperforms peers.
The key point is that a local bullish signal on Solana can coexist with a cautious or sideways broader environment. That makes confirmation levels like the value area low and the developing pattern of higher highs and higher lows even more important.
Outlook: a constructive but conditional bullish phase
From a market structure and price action perspective, Solana is displaying the early signs of a constructive shift. The break of the short‑term downtrend, the formation of a new swing high, and the potential to build a higher low all tilt probabilities toward further upside exploration, as long as key support levels remain intact.
In summary:
– The short‑term bearish structure has been broken, giving bulls an opening.
– Holding above the value area low is non‑negotiable for sustaining this new phase.
– A clear pattern of higher highs and higher lows would confirm a more durable trend transition.
– The $95 resistance level stands out as the next major upside target and decision point.
Until proven otherwise by a loss of critical support, the technical picture favors a path that keeps $95 firmly in focus as Solana navigates its next phase of price discovery.