
Solana price eyes deeper correction toward $52 as consolidation tightens below key SMA
Solana’s latest recovery above the 85-dollar area has not changed the broader technical picture: the asset remains capped under a crucial moving average, and historical behavior suggests this type of sideways pause often precedes a sharper decline. Unless bulls can quickly reclaim that technical line in the sand, the chart continues to point toward a potential slide into the low‑50s.
On Friday morning, Solana (SOL) briefly advanced about 4.5%, tagging an intraday high near 85.2 dollars before easing back to the 83-dollar region. The bounce came in tandem with a broader market upturn as Bitcoin pushed back above 73,000 dollars, helping Solana erase part of the drop that followed its mid‑week rally.
Even so, this rebound has not been sufficient to repair the damage done on the daily timeframe. SOL is still trading beneath its 50‑day simple moving average (SMA), a level that has repeatedly acted as a pivot between continuation rallies and deeper corrections since late 2023. Every recent failure to decisively regain this SMA has, over the past six months, evolved into notable downside extensions.
Since February, Solana has largely been confined to a horizontal band between roughly 76 and 92 dollars. Over the last two weeks, price has gravitated toward the lower boundary of that range, reflecting waning bullish momentum. In that process, SOL slipped under the 50‑day SMA, which currently sits around 86 dollars and now functions as immediate overhead resistance.
Historically, breaks below this moving average have invited a surge in selling pressure. From October 2023 onward, each time Solana has dropped back under the 50‑day SMA after a rally, the pullback has not stopped at the first support; instead, it has progressed into a structured multi‑step pattern that eventually leads to a fresh local bottom.
The behavior of the last six months reveals a recurring three‑phase cycle before each “next leg down.”
1. First, SOL manages to reclaim the 50‑day SMA, often sparking optimism that a new uptrend is underway.
2. Second, the token swiftly loses that moving average again, breaking back below it and giving up support at previous swing highs.
3. Third, price shifts into what can be described as a consolidation trap: a tight, sideways range that gives the impression of stabilization, but has historically preceded a sharper final drop.
This setup appeared clearly in November last year and again at the start of January. In both instances, Solana slipped below the 50‑day SMA, moved sideways for several weeks within a narrow band, and then suffered an aggressive sell‑off that forced it to establish a new, lower base. The consolidations did not mark accumulation, but rather pauses in a broader downtrend.
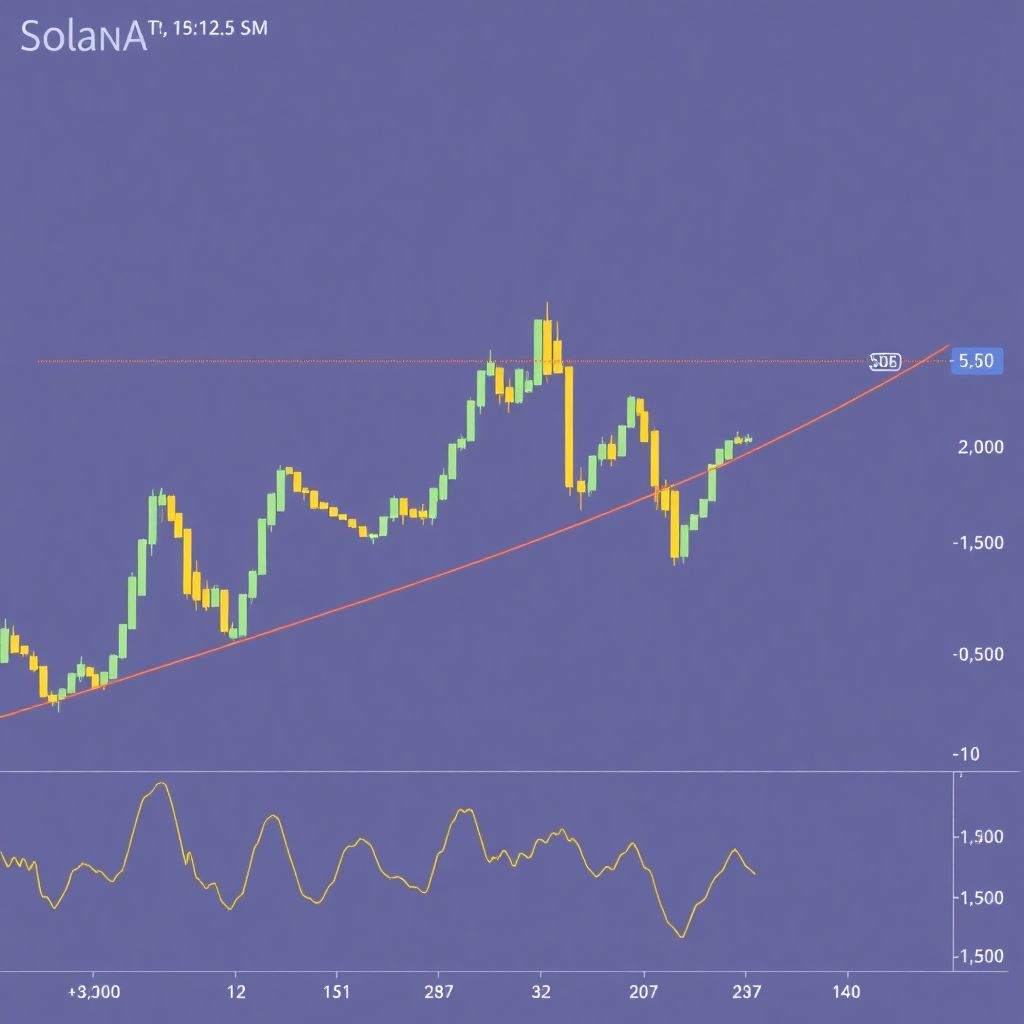
The current structure looks strikingly similar. In mid‑March, Solana staged a breakout above a key resistance zone, rallying all the way to about 97 dollars. That upswing, however, quickly faded. Since then, the token has been carving out a sequence of lower highs and lower lows – a classic downtrend pattern. Over the last few sessions, SOL has become pinned in a confined band between roughly 79 and 81 dollars, with the 50‑day SMA hovering overhead near 86 dollars and acting as a ceiling.
From a technical standpoint, this sideways drift should be treated with caution. Rather than signaling that selling pressure is exhausted, the consolidation may reflect a market in the process of “coiling,” where volatility compresses before a larger directional move. Given the current positioning below the key moving average and the broader structure of lower highs, the risk is that the eventual breakout from this tight range occurs to the downside.
If Solana fails to retake and hold above the 86‑dollar 50‑day SMA in the coming trading sessions, the prevailing pattern suggests sellers could quickly regain control. Based on the average magnitude of the previous declines that followed similar consolidation traps, the projected target for the next leg lower clusters around 52 dollars. That level is derived by applying the typical percentage drop observed in prior cycles to the recent consolidation peak in the high‑80s to low‑90s region.
A move toward 52 dollars would not just be a psychological blow; it would also test how strong longer‑term holders really are. Such a drop would erase a substantial portion of the gains accumulated during Solana’s latest major uptrend and likely flush out late‑cycle buyers who entered near the 90‑100 dollar zone. At the same time, deep pullbacks of this scale have, in the past, attracted new capital from investors seeking discounted exposure to the Solana ecosystem.
It is important to note that while the pattern has repeated several times, no technical setup guarantees an identical outcome. A clean breakout and daily close back above the 50‑day SMA – accompanied by rising volume and a break of recent lower highs – would weaken the bearish thesis. In that more constructive scenario, the 86‑dollar area could flip from resistance back to support, opening the door for another attempt at the upper boundary of the 76-92 dollar range and potentially a retest of the 97‑dollar high.
Traders monitoring this structure often watch several confirmation signals:
– Whether SOL can hold above the 76‑dollar range low on repeated tests.
– How price behaves as it approaches the 50‑day SMA – sharp rejections confirm resistance, while sustained closes above it suggest a trend shift.
– Volume dynamics during the consolidation: declining volume tends to support the “coil before a move” view, while sudden spikes on down days often indicate distribution.
– Momentum indicators, such as RSI or MACD, which can highlight whether bearish momentum is accelerating or fading as price compresses.
From a risk‑management perspective, the current environment calls for clear planning. Short‑term participants may choose to define strict invalidation levels around the consolidation band and the 50‑day SMA, rather than assuming that sideways action guarantees safety. Longer‑term investors, meanwhile, may see a potential drop toward the low‑50s as a chance to build positions at more favorable valuations, but only if it aligns with their tolerance for volatility and time horizon.
The macro backdrop also matters. Solana’s intraday rebound was aided by Bitcoin reclaiming the 73,000‑dollar zone, underlining how strongly major altcoins still track broader market sentiment. Should Bitcoin and the wider crypto market resume a strong uptrend, it could help Solana break the pattern that has previously led to successive legs down. Conversely, if risk appetite cools across the sector, the bearish technical setup on SOL could play out more quickly and more aggressively.
In summary, Solana is currently caught in a narrow consolidation just under a critical moving average that has historically separated bullish continuation from corrective phases. The repeated three‑step cycle – reclaim, lose, consolidate, then drop – remains in play as long as price trades beneath the 50‑day SMA. Until that resistance is convincingly reclaimed, the charts continue to flag an elevated probability of a deeper correction, with the 52‑dollar region emerging as a plausible downside objective.
This analysis is provided for informational and educational purposes only and does not constitute financial or investment advice. Crypto assets are highly volatile, and any trading or investment decisions should be based on your own research, strategy, and assessment of risk.