
XRP prints bullish hammer as cascading liquidations rock the market
The latest XRP price action has delivered a rare combination of technical and sentiment signals: a brutal sell-off, a wave of forced liquidations, and a potentially bullish hammer candlestick on the daily chart. Together they paint a picture of an asset that has been severely punished but may be approaching an important inflection point.
After weeks of steady selling, XRP plunged to its lowest level since April of last year, mirroring the broader collapse across the crypto market. The token fell to around $1.50, erasing roughly 55% from its 2025 peak and wiping out billions of dollars in paper gains for holders. This decline has not happened in isolation; it is part of a synchronized downturn that has dragged most major coins deep into correction territory.
Bitcoin, the market bellwether, slipped below the psychologically and technically important $80,000 support area, confirming that selling pressure is not limited to smaller altcoins. Many leading cryptocurrencies have now dropped more than 50% from their all‑time highs, a magnitude of correction that historically corresponds with periods of extreme fear and forced deleveraging.
XRP has been hit from multiple directions at once. On the spot market, heavy selling has dominated as investors rushed to reduce risk. At the same time, flows in exchange-traded products tied to XRP turned decisively negative. Spot XRP funds saw outflows of more than $52 million last week, following $40 million in redemptions the week before. This is occurring in spite of the fact that cumulative net inflows into these products still sit above $1.18 billion, underscoring how quickly sentiment has reversed from accumulation to capitulation.
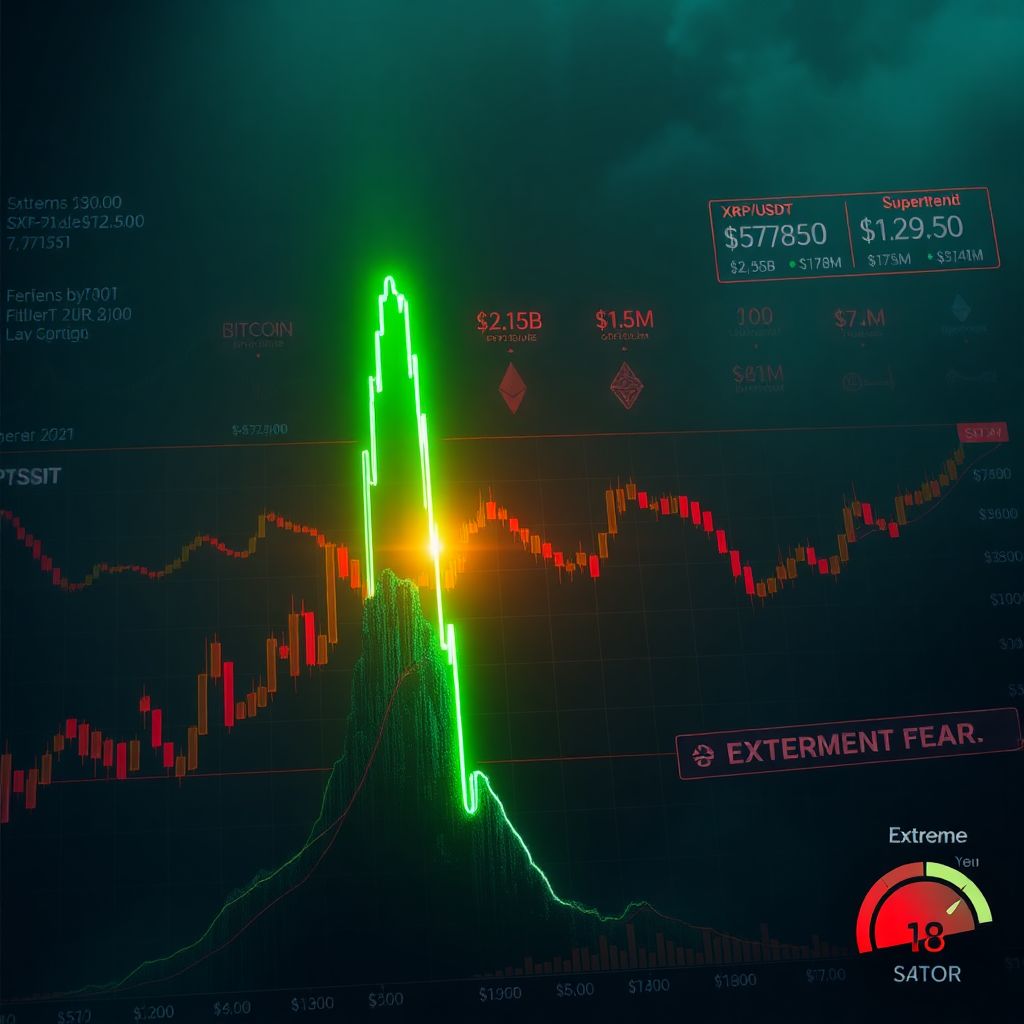
Derivatives markets amplified the move. Data on leveraged positions show that liquidations across the entire crypto complex soared by 357% in a single 24-hour window, reaching roughly $2.58 billion. Ethereum traders were the hardest hit with more than $1.15 billion in positions liquidated, while Bitcoin saw around $785 million wiped out. XRP was not spared: over $61 million in XRP positions were forcibly closed as margin calls and stop-outs cascaded through the order books.
This violent flush coincided with a sharp deterioration in sentiment indicators. The Crypto Fear and Greed Index, a composite gauge tracking market mood, plunged into the “extreme fear” zone with a reading near 18. Historically, readings at these levels tend to align with panic selling, forced exits, and a widespread reluctance to deploy fresh capital. Price often declines fastest during these phases, even as long‑term risk‑reward metrics quietly improve for patient investors.
On the daily chart, the structural damage is obvious. XRP has fallen from a July high near $3.6622 down to the recent low around $1.50, a multi-month downtrend marked by a sequence of lower highs and lower lows. The price sliced through a key horizontal support band near $1.7920, an area that previously acted as a floor in October, November, and December of last year. Losing that level to the downside is a clear technical victory for the bears and confirms that sellers have been in control of the medium‑term trend.
The token currently trades below all major moving averages, including the 50-day and 200-day, and remains beneath the Supertrend indicator. This alignment is typically interpreted as a bearish configuration, signaling that rallies have, so far, been opportunities to sell rather than to buy. For trend-following systems, XRP is still in a confirmed downtrend.
However, the latest daily candle has introduced a notable counter-signal: a textbook hammer candlestick pattern. This formation features a small real body near the top of the candle range and a long lower wick, indicating that sellers initially drove the price sharply lower but were ultimately overwhelmed by buyers who pushed it back toward the opening level by the close. In other words, demand absorbed the sell-off at the lows, hinting at exhaustion among bears.
In classical technical analysis, a hammer appearing after an extended decline is considered a bullish reversal signal. It does not guarantee an immediate trend change, but it suggests that the balance of power may be starting to shift. For XRP, this opens the door to a potential relief rally or even the early stages of a larger recovery if follow‑through buying emerges in subsequent sessions.
The first meaningful upside objective in such a scenario is the broken support zone near $1.7920. A move back toward this area would represent roughly a 9% recovery from current prices and would fit the classic “break-and-retest” pattern: price loses support, sells off, then climbs back to test that former floor as new resistance. Technicians typically treat this structure as a bearish continuation setup, meaning that even if XRP bounces to $1.7920, the broader downtrend remains intact unless key resistance levels are reclaimed.
Confirmation of a more durable recovery would require XRP to do more than simply tap that retest zone. Traders will be watching closely to see if the price can break back above the 50-day moving average and flip the Supertrend indicator from red (bearish) to green (bullish). A decisive close above these dynamic resistance levels, ideally accompanied by rising spot volume and cooling liquidation activity, would strengthen the case that the hammer was not just a one-day anomaly.
For now, the market is caught between two opposing forces. On one side, structural signals remain negative: price is below major averages, sentiment is deeply fearful, and macro conditions across crypto are hostile. On the other side, the hammer candle, the scale of recent liquidations, and the severity of the drawdown suggest that much of the leveraged excess has already been washed out, which can create conditions for sharp countertrend rallies.
Short-term traders may view this environment as fertile ground for tactical setups rather than long‑term positioning. Aggressive participants sometimes use hammer patterns as entry points, placing tight invalidation levels just below the low of the hammer wick. If the low holds and price moves higher, the risk-reward profile can be attractive. If the low is breached decisively, the setup fails quickly, limiting losses. However, such strategies are highly sensitive to volatility, which remains elevated.
Longer-term investors, by contrast, may be less focused on the immediate hammer signal and more concerned with whether XRP can reclaim its lost structural supports. From a macro perspective, sustained bull phases in XRP have historically aligned with improving conditions in Bitcoin, easing liquidation pressures across derivatives, and a gradual shift in the Fear and Greed Index from extreme fear back toward neutrality or cautious optimism. Without those broader tailwinds, any bounce risks becoming just another bear-market rally.
Risk management is crucial in this phase of the cycle. The recent wave of liquidations is a stark reminder of the dangers of excessive leverage, especially when volatility spikes. Many traders who entered late into the prior uptrend with high margin have now been forced out at or near the lows. Avoiding this pitfall typically means sizing positions conservatively, using clearly defined stop levels, and recognizing that even strong technical patterns, like the hammer, can fail in the face of powerful macro headwinds.
Another factor to watch is market structure around liquidity pools and order-book depth. The sharp lower wick on the hammer candle implies that a significant cluster of stop orders and liquidations was triggered below prior support levels, providing liquidity for larger buyers to step in. If subsequent candles show narrower ranges and higher closes, that would signal that this demand is persistent rather than opportunistic. Conversely, a swift return to heavy selling would indicate that the hammer was merely a pause before the next leg down.
The behavior of institutional vehicles tied to XRP will also be important in the coming weeks. While recent weeks have seen notable outflows from spot funds, a stabilization or reversal in those flows could serve as an early sign that professional investors view current levels as attractive for accumulation. A continued bleed, however, would reinforce the narrative that institutions are still in risk‑reduction mode.
In sum, XRP is at a technically interesting yet precarious juncture. The crash to $1.50, the surge in liquidations, and the dive in sentiment all point to a market under extreme stress. Against that backdrop, the emergence of a bullish hammer on the daily chart introduces the possibility of a short‑term bottom and a move back toward the $1.7920 zone. Whether that potential rebound evolves into a sustained trend reversal will depend on XRP’s ability to reclaim key moving averages, flip the Supertrend, and ride an improvement in the broader crypto environment.
Until those confirmations arrive, traders and investors are likely to treat XRP’s hammer not as a guarantee, but as an early signal worth watching closely in a market that remains volatile, fragile, and highly sensitive to further waves of liquidation or renewed selling pressure.