
XRP bulls focus on crucial support as TD Sequential hints at short‑term top
XRP has staged a notable rebound from its recent multi‑week low, climbing back into a key support area that many traders are watching to gauge the next major move. At the same time, the widely followed TD Sequential indicator is flashing signals that the current upswing may be nearing a local top, putting short‑term momentum under scrutiny even as broader interest in XRP remains strong.
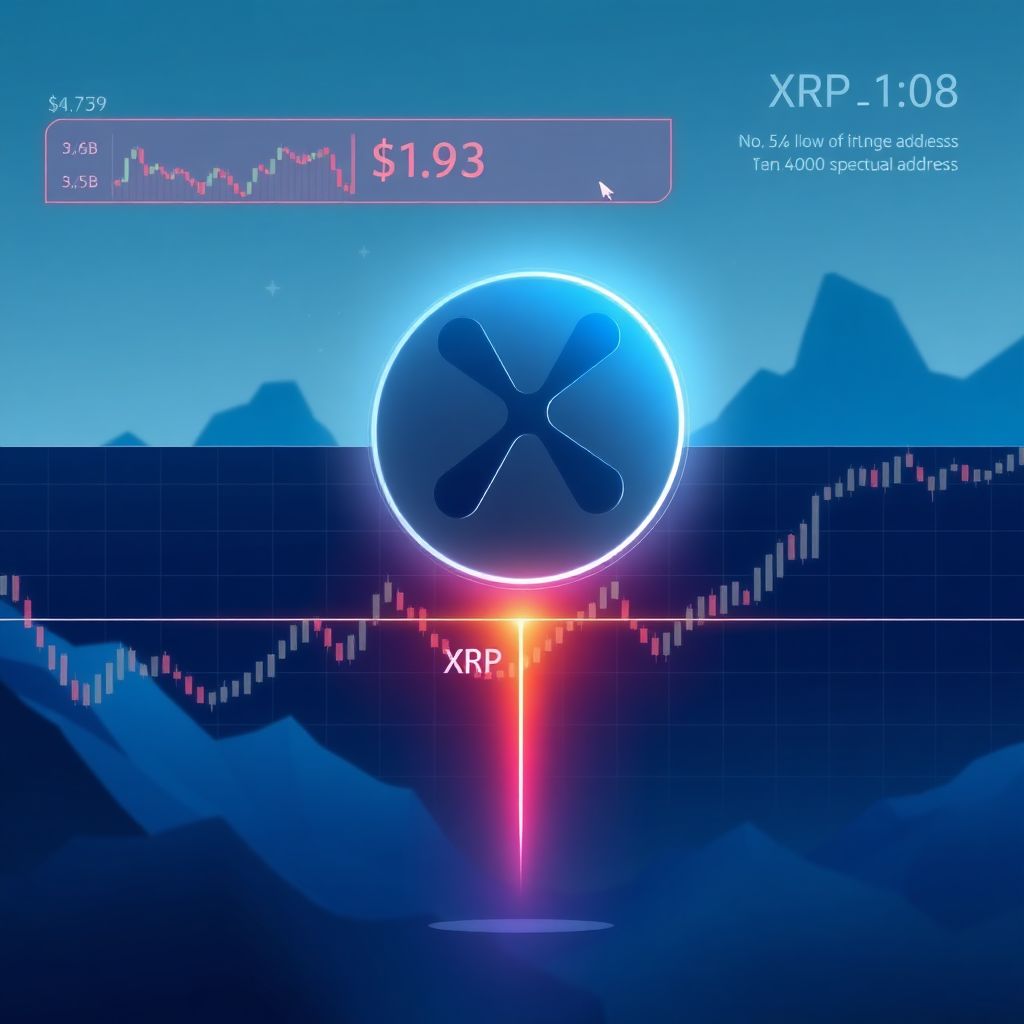
At the time of writing, XRP is changing hands around $1.93, placing it roughly 8–9% below last week’s peak. Despite this pullback from the highs, price action is still confined to a relatively well‑defined range, bounded by strong support below and resistance above. Daily trading volume hovers near $5.7 billion, underscoring robust liquidity and continued participation from both retail and institutional traders, even as price remains largely range‑bound.
The TD Sequential indicator, a tool used by technical analysts to identify potential exhaustion points in ongoing trends, has now suggested that XRP may be forming a short‑term top following its recent recovery. Data shared by analyst Ali Martinez shows that the indicator has flipped into a zone typically associated with waning bullish momentum, prompting some traders to consider the risk of a cooldown or corrective phase.
This isn’t the first time TD Sequential has drawn attention in the XRP market. Following a sharp decline in late November, the same indicator flashed a buy signal that preceded a meaningful recovery in the days that followed. Historical charts reveal several instances where TD Sequential anticipated notable inflection points for XRP, both on the upside and the downside. Its track record has led some market participants to treat fresh signals with heightened respect, especially when they align with other technical levels.
Beyond buy signals, the indicator has also generated timely sell alerts in prior cycles, often coinciding with local tops or periods of consolidation after strong rallies. Analysts who follow the tool emphasize that it is most effective when used alongside support and resistance analysis, rather than in isolation. In the current environment, the new potential sell or “top” signal appears just as XRP retests a critical area on the chart, increasing the importance of how price behaves in the coming sessions.
Market watcher CryptoWZRD points out that XRP’s most recent daily close was “indecisive,” characterized by a lack of clear direction and relatively neutral candlestick structure. This indecision mirrors the broader sentiment across major crypto assets, with Bitcoin showing modest gains while XRP’s price remained largely flat. Such behavior often reflects a market waiting for a catalyst—whether macroeconomic data, regulatory developments, or a decisive break of a technical level.
For now, XRP continues to hold above a support zone that traders view as a structural line in the sand. As long as price remains atop this region, bulls can argue that the broader uptrend or accumulation phase remains intact. However, a clear breakdown below this area could open the door to a deeper correction, especially if the next layers of support fail to absorb selling pressure. In that scenario, sentiment could quickly flip from cautious optimism to defensive positioning.
On‑chain data adds another piece to the puzzle. The number of active XRP addresses has slipped from around 46,000 to roughly 38,500 over the past week, indicating a decline in short‑term network activity. While a dip in active addresses does not automatically translate into bearish price action, it can signal reduced speculative engagement or a pause in user‑driven flows. Traders often track such metrics to assess whether a move is being supported by growing participation or occurring on thinner, less convincing activity.
Interestingly, the softening in some on‑chain indicators and the possibility of a local price top have not discouraged institutional‑style exposure. Spot XRP exchange‑traded funds have recorded several consecutive days of net positive inflows since the first product went live. This continued appetite suggests that certain investors are using periods of price consolidation or modest retracements as opportunities to build or rebalance positions with a longer‑term horizon in mind.
The resilience of ETF inflows contrasts with the choppy spot market and may hint at a gradual shift in how XRP is being adopted as an investment vehicle. While short‑term traders focus on intraday swings and indicator‑driven setups, ETF participants typically take a broader view, looking beyond immediate volatility to multi‑quarter or multi‑year narratives. For XRP, those narratives often revolve around payments use cases, regulatory clarity, and its role within the evolving digital asset infrastructure.
From a technical standpoint, the confluence of a potential TD Sequential top and a retest of key support creates a classic inflection zone. If bulls manage to defend the support area convincingly, XRP could invalidate the bearish implication of the indicator in the near term and attempt another move toward recent highs. A strong bounce from support, accompanied by rising volume and a rebound in active addresses, would strengthen the case for renewed upside.
Conversely, failure to hold this level could confirm the TD Sequential’s warning and trigger a more pronounced corrective phase. In that case, traders will likely watch for signs of capitulation or fresh accumulation at lower levels, such as long wicks on daily candles, spikes in volume on down days, or a revival in address activity as bargain hunters and longer‑term buyers step in.
Short‑term speculators may choose to treat the current zone as a pivot for tactical positioning. Some might tighten stop‑losses or reduce leverage given the risk of a pullback signaled by TD Sequential, while others may look for confirmation—such as a decisive break below support or a reversal pattern on lower time frames—before acting. Range traders, on the other hand, could see this as another opportunity to trade the established band between support and resistance until a clear breakout occurs.
For investors taking a broader view, the current situation highlights the tension between technical signals and structural developments. On one side, momentum indicators are flashing caution; on the other, ETF inflows and substantial liquidity suggest that interest in XRP as an asset class remains alive and well. Balancing these signals often requires clarity on one’s time horizon: short‑term traders might lean more heavily on indicators like TD Sequential, while longer‑term participants may focus on adoption metrics, regulatory context, and macro trends.
Risk management remains crucial in this kind of environment. XRP’s history is marked by sharp rallies and equally abrupt corrections, so even seemingly small shifts in sentiment can quickly magnify into outsized moves. Diversification across assets, defined entry and exit plans, and disciplined position sizing become particularly important when indicators point to potential turning points.
In the coming days and weeks, attention will likely center on three intertwined dynamics: whether XRP can defend its current support area, how the TD Sequential signal plays out relative to actual price behavior, and whether ETF inflows and institutional interest continue to build despite short‑term volatility. If support holds and flows remain positive, the current pause could be remembered as a consolidation phase before the next leg of the trend. If not, it may mark the start of a recalibration in expectations, at least until a new base is established.
For now, XRP sits at a crossroads: buoyed by strong liquidity and ongoing ETF demand, yet shadowed by a technical indicator suggesting that the latest bounce may be running out of steam. How the market resolves this tension will shape the next chapter in XRP’s price story—whether as a brief local top within a larger bullish structure, or the early stages of a deeper correction that tests the commitment of bulls.